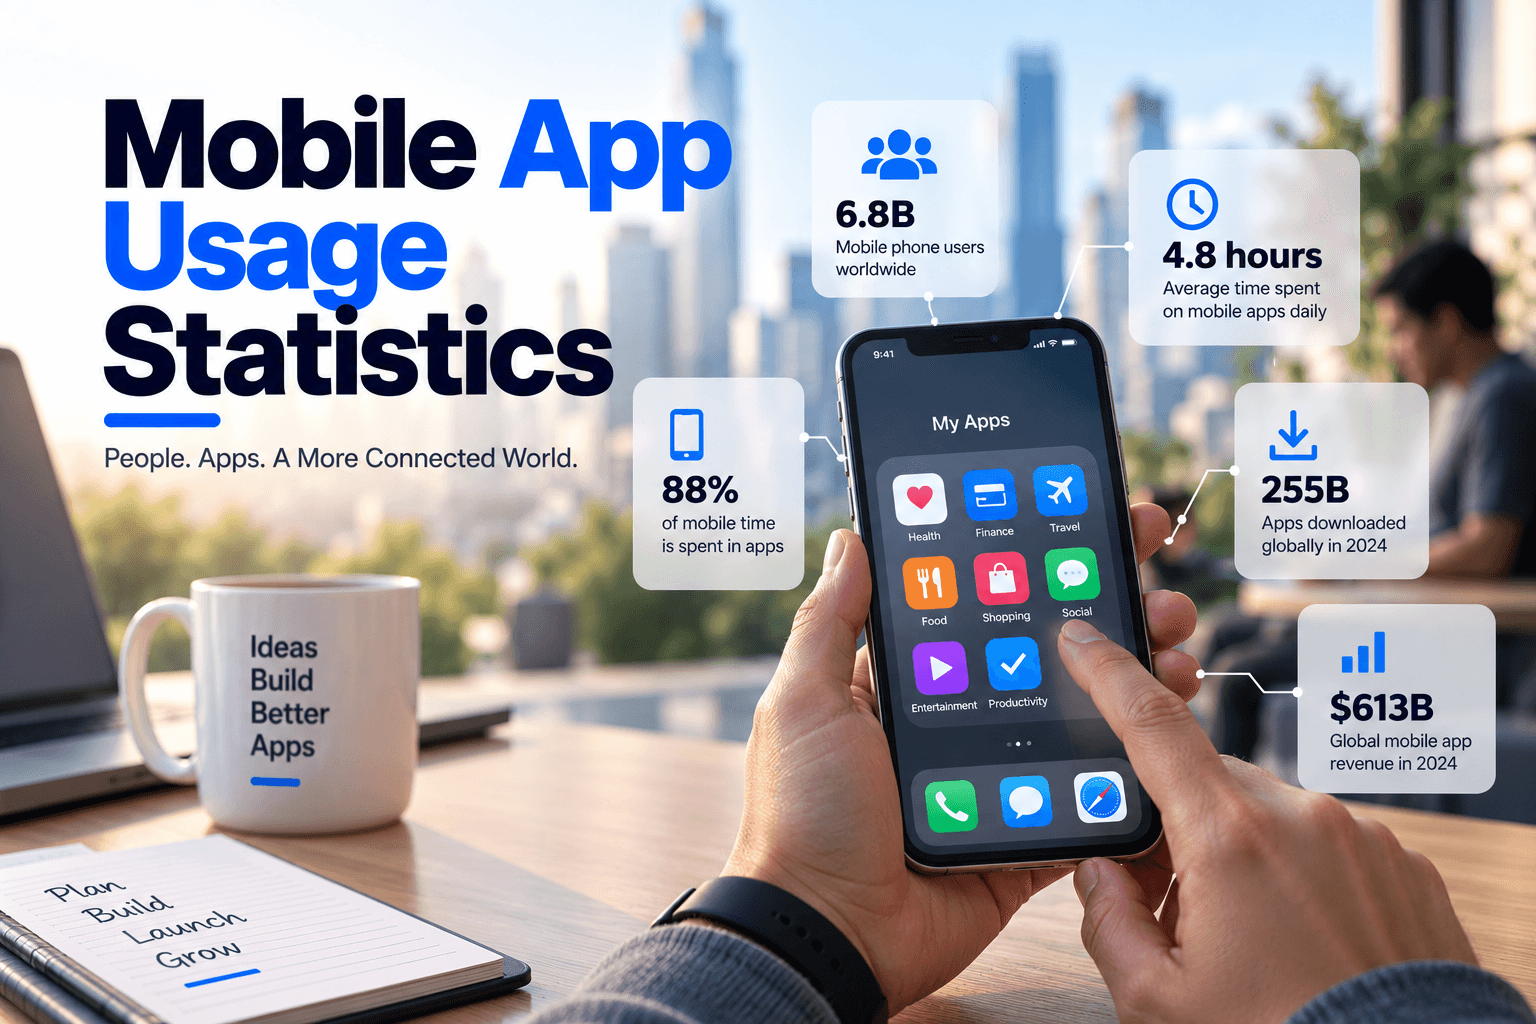
Usage data tells you something different from revenue data, and for anyone deciding what to build it tells you more. Attention is heavily concentrated in a few categories, installs have almost stopped growing, and one large category went backwards in 2025. This page covers time spent, download behaviour, where attention actually sits, and the mobile-versus-web split, with each figure attributed and dated. Revenue and market sizing are covered separately.
Time Spent and Install Growth
The two headline behaviour figures move at very different rates, which is the most useful thing in this dataset.
Total Time in Apps
Users spent 5.3 trillion hours in apps across iOS and Android in 2025, up 3.8% year over year, per Sensor Tower’s State of Mobile 2026.
Installs Have Flattened
New app downloads across iOS and Google Play reached 149 billion in 2025, up just 0.8%.
What the Gap Indicates
People are not installing many more apps and they are spending somewhat more time in the ones they have. Acquisition is harder, engagement is holding.
The Planning Implication
A business case built on install growth is fighting the trend. Our MVP development scoping tests retention assumptions before acquisition assumptions.
Where Attention Actually Sits
Attention is concentrated far more heavily than most category planning assumes, which matters if you are entering a category outside the top two.
Social Media Dominates
Social media accounted for nearly 2.5 trillion combined hours in 2025, the largest single block of attention by a wide margin.
The Top Two Categories
Social media and gaming together account for roughly 72% of total time spent in mobile apps.
What That Leaves
Every other category, including productivity, health, finance, education, commerce, and utilities, shares the remaining share of attention between them.
Why This Matters for Product Decisions
Competing for time against social and gaming is a losing framing. Competing for a specific task within a workflow is not. Our UI/UX design work targets task completion rather than session length for most products.
A Category That Went Backwards
The most instructive single data point in 2025, because it contradicts the assumption that mobile categories only grow.
Retail Declined on Both Measures
Global retail app downloads and time spent both fell in 2025, which Sensor Tower attributes in part to slower expansion by major shopping apps.
Why Decline Is Informative
It demonstrates that category growth is driven by specific large players expanding rather than by a general rise in mobile behaviour.
The Lesson for Category Entry
Check whether a category’s growth is broad or attributable to two or three companies. If the latter, the growth is not available to you.
What This Says About Saturation
Some mobile categories have reached the limits of behaviour change. Our ecommerce development work plans around that rather than assuming headroom.
Mobile Versus Web Behaviour
The split between mobile and web usage has shifted meaningfully and affects where products should be built rather than only how.
Mobile-Only Usage
By December 2025, mobile-only usage climbed to roughly 50% market share in the United States, while web-only usage declined to approximately 27%.
Where Each Dominates
Mobile apps dominate consumer interaction and conversion. Web dominates enterprise software revenue and discovery.
The Composite Pattern
Most successful products use both rather than choosing, with mobile carrying engagement and web carrying discovery and enterprise sales.
Build Implication
Platform choice follows audience behaviour rather than preference. Our cross-platform app development work covers mobile without abandoning web.
Geographic and Platform Behaviour
Two further behavioural patterns worth knowing when planning launch and localisation.
Usage Crosses Borders
Nearly four in five downloads and dollars spent happened outside the country where the app was built, which makes localisation a default consideration rather than an expansion phase.
App Store Reach
The App Store averaged over 850 million weekly users across 175 countries and regions.
AI App Reach
Close to 700 million people used AI apps in the first half of 2025, which is rapid adoption of a category that barely existed as consumer software several years earlier.
What to Take From This
Assume an international audience from the first release rather than designing for one market. Our software development work treats localisation readiness as an architecture decision.
FAQs
How much time do people spend in mobile apps?
Users spent 5.3 trillion hours in apps across iOS and Android in 2025, up 3.8% year over year per Sensor Tower’s State of Mobile 2026. Time spent is growing modestly while installs have almost flattened.
Are app downloads still growing?
Barely. New downloads reached 149 billion in 2025, up 0.8%. Growth in the mobile ecosystem is coming from deeper engagement with existing apps rather than from people installing substantially more of them.
Which app categories get the most usage?
Social media is the largest by a wide margin at nearly 2.5 trillion hours in 2025. Social media and gaming together account for roughly 72% of total time spent, leaving all other categories to share the remainder.
Did any app category shrink?
Yes. Global retail app downloads and time spent both fell in 2025. That is instructive because it shows category growth depends on specific large players expanding rather than on a general rise in mobile usage.
Is mobile replacing web usage?
Partly. By December 2025, mobile-only usage reached roughly 50% share in the US against approximately 27% web-only. Mobile dominates consumer interaction and conversion while web dominates enterprise software revenue and discovery.
Should I plan for international users from launch?
Yes. Nearly four in five downloads and dollars spent occur outside the country where the app was built, which makes localisation readiness an architectural consideration rather than a later expansion project.