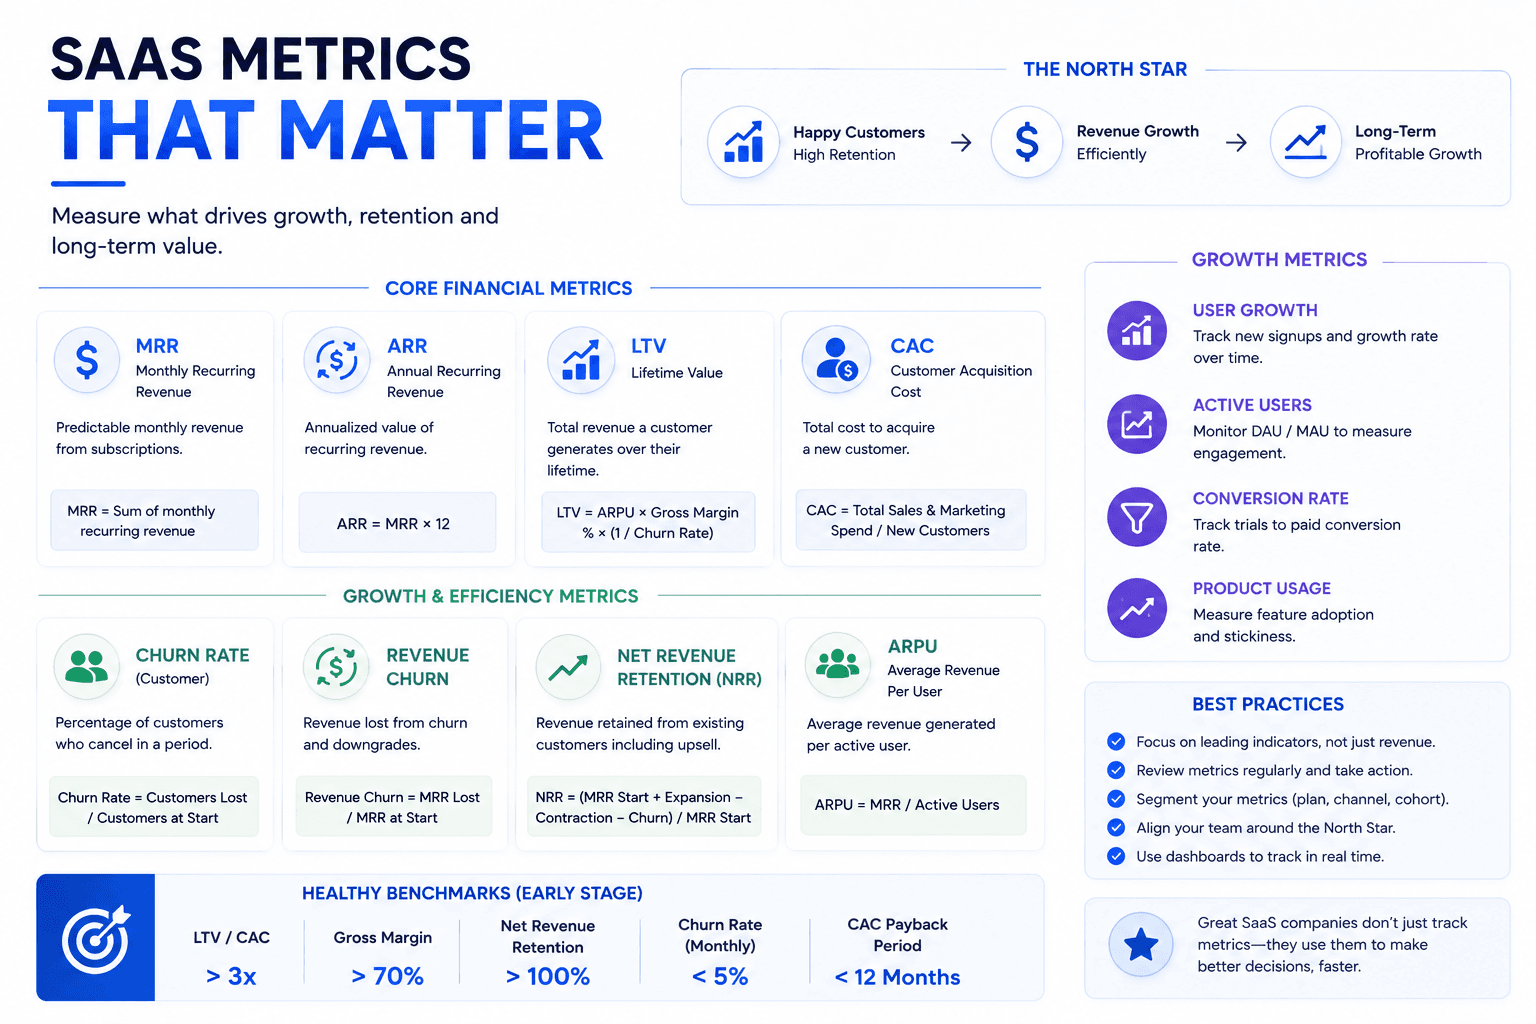
Most SaaS dashboards track more numbers than anyone acts on, which produces the impression of measurement without the substance of it. The metrics that matter are the ones that change a decision: whether to spend more on acquisition, where the product is failing, and whether the business improves as it grows. Everything else is reporting. This guide covers the measures that drive those decisions, how to calculate them so they stay honest, and which widely quoted figures reliably mislead the teams watching them.
Measuring Retention Before Anything Else
Retention determines whether every other number means anything. A business acquiring customers who leave within months is not growing, it is refilling. This is why retention deserves attention before acquisition spend, pricing changes, or expansion planning, and why investors examine it first during diligence. The complication is that a single headline retention figure conceals more than it reveals, so measurement needs to separate customer counts from revenue and examine cohorts rather than aggregates.
Separating Logo and Revenue Retention
Customer count retention and revenue retention tell different stories. Losing many small accounts while keeping large ones looks healthy on revenue and unhealthy on logos, and both facts matter.
Tracking Net Revenue Retention
Net revenue retention combines churn, downgrades, and expansion within your existing base. Above one hundred percent means the business grows without acquiring anyone, which is the strongest signal available.
Analysing by Cohort Rather Than Aggregate
Aggregate retention masks whether recent customers behave better than older ones. Cohort analysis reveals whether product and onboarding changes are actually working.
Segmenting by Customer Type
Retention usually varies substantially by plan, industry, or acquisition channel. The segments that retain poorly often reveal that you are selling to the wrong buyer rather than that the product fails.
Grounding Analysis in Reliable Data
Retention figures depend on consistent event definitions. Establishing that foundation through data analytics practice prevents metrics that shift meaning between reports.
Understanding Acquisition Economics
Acquisition metrics answer whether growth spending is investment or expenditure. The critical figure is not what a customer costs to acquire but how long that cost takes to recover and what the customer is worth afterwards. Businesses frequently scale acquisition on the strength of a favourable cost figure without checking payback period, then discover that growth consumes cash faster than it generates it. Both numbers need watching together, and neither means much without reliable retention data underneath.
Calculating Acquisition Cost Fully
Include salaries, tooling, and overhead alongside advertising spend. Marketing-only figures understate the real cost substantially and make channels look better than they perform.
Watching Payback Period Closely
Payback period determines cash requirements as you scale. A favourable lifetime value ratio with a long payback still constrains growth, because the cash leaves before it returns.
Treating Lifetime Value Cautiously
Lifetime value calculations rest on retention assumptions that early-stage businesses cannot yet support. Use conservative figures and revisit them as actual retention data accumulates.
Comparing Economics by Channel
Blended averages hide channels that lose money and channels that print it. Segmenting by source is what turns acquisition reporting into a decision rather than a summary.
Connecting Pricing to Unit Economics
Packaging changes move acquisition cost, expansion, and churn together. Reviewing SaaS pricing models alongside these metrics prevents optimising one at the expense of another.
Tracking Product Engagement That Predicts Outcomes
Engagement metrics are valuable only where they predict something. Logins and session counts are widely tracked and rarely useful, because they measure presence rather than value received. The engagement measures worth watching are the ones that correlate with renewal, which means identifying the specific actions that distinguish customers who stay from those who leave. That correlation is discoverable from your own data and differs meaningfully between products.
Identifying the Activation Moment
Find the action after which retention improves sharply. Getting more customers to that point quickly is usually the highest-leverage product work available.
Measuring Depth Rather Than Frequency
How much of the product a customer uses predicts renewal better than how often they log in. Breadth of adoption correlates with switching cost.
Watching Usage Trend Direction
Declining usage precedes cancellation by weeks or months. Trend direction is a more actionable signal than any absolute usage figure at a point in time.
Distinguishing Account and User Engagement
An account may look healthy while only one person uses it. Single-user dependency inside a multi-seat account is a concentrated and often invisible churn risk.
Building Predictive Health Scoring
Combining these signals into a health score through predictive analytics lets teams intervene before renewal rather than after cancellation.
Avoiding Metrics That Mislead
Some widely reported numbers actively distort decisions. They tend to be the ones that look best in updates, which is part of why they persist. Recognising them matters because teams optimise whatever is reported, and reporting the wrong figure produces effort directed at improving a number rather than the business behind it. The test is straightforward: if a metric cannot get materially worse while the business gets better, it is probably not measuring anything useful.
Ignoring Cumulative Totals
Total signups and total revenue since inception only rise. They cannot indicate a problem, which makes them unsuitable for any decision.
Treating Averages With Suspicion
Average revenue per account conceals distribution. A handful of large customers alongside many small ones produces an average describing nobody, and hiding concentration risk.
Discounting Vanity Growth Rates
Percentage growth from a small base impresses without informing. Absolute figures alongside percentages keep the picture honest, particularly in early reporting.
Reporting Trials Against Conversion
Trial starts mean little without conversion rates attached. Rising trials with falling conversion usually indicates the acquisition targeting has drifted.
Keeping Definitions Stable Over Time
Metrics redefined between periods make comparison impossible. Documenting calculations and holding them stable is what makes reporting trustworthy across the product lifecycle.
Frequently Asked Questions
What is the most important SaaS metric?
Net revenue retention, because it combines churn, downgrades, and expansion into one figure showing whether your existing base grows without new acquisition. Above one hundred percent indicates the business compounds on its own, which is the strongest structural signal available.
How do you calculate customer acquisition cost properly?
Include all sales and marketing costs, salaries, tooling, and overhead, divided by customers acquired in the same period. Advertising-only calculations understate the true figure substantially and make underperforming channels appear profitable.
What is a good churn rate?
It varies considerably by segment and contract value, so external benchmarks rarely apply cleanly. More useful is whether your churn is improving cohort over cohort, and whether specific segments churn worse than others in ways you can address.
Should early-stage SaaS track lifetime value?
Track it, but treat it cautiously. Lifetime value depends on retention assumptions that early businesses have not yet earned the data to support. Use conservative estimates and revise as real retention accumulates rather than planning on optimistic projections.
Which metrics should we ignore?
Cumulative totals that can only rise, averages that conceal distribution, percentage growth from small bases without absolute figures, and any engagement measure that has not been shown to correlate with renewal in your own data.
How often should SaaS metrics be reviewed?
Retention and engagement monthly with cohort detail, acquisition economics monthly by channel, and the full picture quarterly against strategy. More frequent review of retention data tends to produce reaction to noise rather than genuine signal.